This blog is an evaluation of the sugar industry. We have tried to give a detailed understanding about how this industry operates and its structure.
Disclaimer: This blog is not a recommendation to buy / hold / sell any stock. This blog is mainly for information and educational purpose only. The intention to share write ups on this blog is to create a repository of ideas so that investors / visitors on the website / blog can have a look at various frameworks & approaches. Please read the detailed disclaimer at the bottom of the post.
Sugar Industry – Snapshot:
Sugar is an essential consumer staple and forms a part of the daily diet for consumers around the globe. It is one of the major agricultural commodities produced around the world. While it's consumption has been widely stagnant, the supply side has been quite volatile, making this sector very volatile.
Sugar is derived from sugarcane. Sugarcane being a highly water intensive crop, insufficient/ irregular/good rainfall disrupts both sugarcane output and sugar production. A mismatch of demand and supply changes the dynamics of the prices to the extreme, leading to wide variation in earnings of the sugar companies, making their growth more zig-zag rather than linear.
To overcome the erstwhile problem of mismatch of demand and supply of sugar, the global industry with the aid of their respective government, started diverting sugar to ethanol (biofuel) which could be blended with gasoline and further used in vehicles. This initiative has led to reduction in the demand-supply mismatches.
But with the introduction of Ethanol, will the problems in the sugar industry end completely?
Can cyclicality so easily be removed?
Or is the cyclicality an inherent feature of sugar, that no one can part away with?
- Sugarcane Yield = It is the amount of sugarcane grown per unit area of farmland (density).
- Sugar Recovery Rate = It is the percentage of sugar produced on every tonne of sugarcane crushed.
- Acreage = Area under cultivation
- SS = Sugar Season (SS21 = Oct 20 to Sept 21)
- ESY = Ethanol Supply Year (e.g., December 2020-November 2021)
- MSP of Sugar = Minimum Selling Price
- FRP of sugarcane = Fair remunerative price of sugarcane
- SAP of sugarcane = State Advised price of sugarcane
- GOI = Government of India
- MAEQ = Maximum Admissible Export Quantity
- MIEQ = Minimum Indicative Export Quotas
- A heavy = Direct cane juice extraction (also called Juice-route)
- OGL= Open General License
- KLPD = Kilo liters per day
- MT = Million tonnes
Sugar Process:
The above is the breakup of the products that extracted when 1 tonne of sugarcane is crushed.
- Sugar - It refers to a sweet crystalline substance which is prepared from sugar cane and sugar beet.
- Molasses - is the dark, sweet, syrupy byproduct made during the extraction of sugars from sugarcane and sugar beets. It is further used to produce ethanol.
- Bagasse - is the dry pulpy fibrous material that remains after crushing sugarcane or sorghum stalks to extract their juice. It is used as a biofuel for the production of heat, energy, and electricity, and in the manufacture of pulp and building materials.
- Press Mud – Is used as a bio fertilizer.
Various countries have been changing the ratio of sugar and molasses extracted from sugarcane in order to reduce the volume of sugar and divert the same towards ethanol.
Global Scenario
Major sugar producing countries:
Brazil is not only the largest producer in the world but also a big influencer to the sugar prices. (explained below) More than 20% of the global sugar is produced in the country at the lowest cost of production. The world production of sugar ranges between 150 MT to 190 MT. Over the past couple of years, the production of Brazil and India have been neck to neck. About 50 MT of sugar is traded.
Brazil, Thailand and India are the 3 major sugar exporters in the world. Thailand on the other hand has been facing draught for two years which has lowered the production from the country. The above figure also showcases lower production from Thailand.
In the SS 2020-21 global sugar production is estimated to fall to around ~169 MT, significantly below 180.8 MT of sugar produced in SS 2019-20. The global sugar deficit forecast for SS 2021-22E is set to rise due to various reasons explained below:
Overview of the key sugar manufacturing countries:
Brazil:
Brazil is the leading sugar producer and exporter, accounting for 20% of the global production and 40% of global sugar exports. Brazil has been the world’s largest sugarcane producer for many decades. Substantial sugarcane production in Brazil is finding its way for ethanol production.
Brazil was the first country to enable the ethanol blending policy. Major of the Brazilian’s sugar mills are flexible and can produce more sugar or ethanol depending on the price premium of one over another. With easing up of global covid restrictions, the demand for ethanol is expected to rise in Brazil which implies that the sugar production is going to be on a lower side.
Moreover, despite ongoing Brazilian crushing season, sugar prices have been firm considering an expected 5-6 MT decline in Brazilian sugar production in the 2021-22 season. Brazil is facing a severe drought, which has reduced the water availability for the ongoing sugar crop. Further, recent frost has also destroyed the sugarcane crop in many areas in south central Brazil.
Further, ethanol prices have risen 3x in the last one year, which is also likely to change the sugar-ethanol mix to 44-56% against 47-53% last year. This would result in 5-6 MT decline in sugar production to 32 MT (38 MT last year) in south central Brazil.
Thailand:
Thailand is one of the major sugars producing countries in the world. It is the second major sugar exporting country in the world. Thailand’s overall sugar output is estimated at 8 MT in SS 2020-21, a ~50% decline compared to 14 MT in SS 2019-20. This decline was attributed to the worst drought that the country has witnessed in last 40 years.
The reduction in sugar volumes from these two countries has made way for Indian sugar exports as the prices of sugar have been on the upward trend matching high costing sugar of India.
“The deficit expectation is reflected in the strong rally in raw and white sugar prices. All of this is helping sugar to extend its scorching rally.”
India:
The only country which has been an accumulator of tailwinds like Thailand having a bad crop; Europe’s output has declined and Brazil is set to make less sugar after a drought last year, ongoing frost and curbed cane development, Indian government is giving various subsidies to sugar producers, robust increase in ethanol capacities; Indian sugar industry is living its best days and could have never been happier. The sugar market was counting on 6 MT of Indian exports with a subsidy rate of Rs. 4000/tonne (Rs. 4/kg), which was not only fulfilled but also an additional 1.2 MT was exported without government aid on account of higher pricing of the commodity. It looks like this is the first time the country is walking it's way on a sugar cycle with it's head held up high, unlike crawling with pain most of the times.
Global Sugar Balance:
- The above table is the heart of the entire sugar industry, with it's growing pulse rate (inventory) which has made this commodity very risky.
- The prices of sugar are largely dependent on the inventory held.
- High inventory reduces the prices of sugar and vice-versa.
- In SS 2009 to SS 2011, we saw the prices plunge and surge at the lowest and the highest level till date.
- Since SS 2018, the high inventory has been a concern (more than 10% belongs to India) and we have seen that the prices of sugar have been muted since then, as can be seen below.
- To sum it up, the entire industry’s headwinds and tailwind depend on the above math.
- The inventory for the current sugar season is expected to drop by around 5 MT.
The above inventory drop has given rise to the prices of sugar in the global market which has helped the Indian exporters to export without any subsidy or government aid. Though the production numbers of Brazil and Thailand are very low, Indian production numbers are high and hence they will substitute the loss in production from the other two countries to some extent.
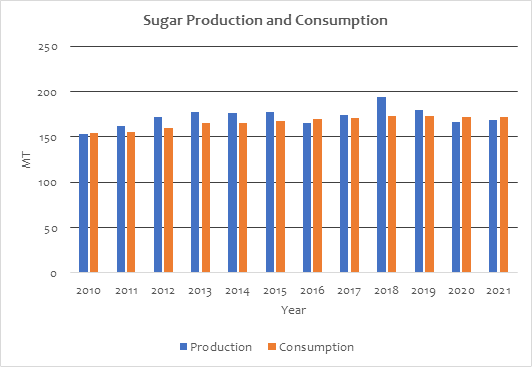
Production and Consumption of Sugar:
The consumption of sugar has been more or less stagnant leaving no growth opportunities for the millers in this segment. But the supply has been good and has generally exceeded the consumption leading to price volatility.
(Source: Sudzucker AG Annual report page 67)
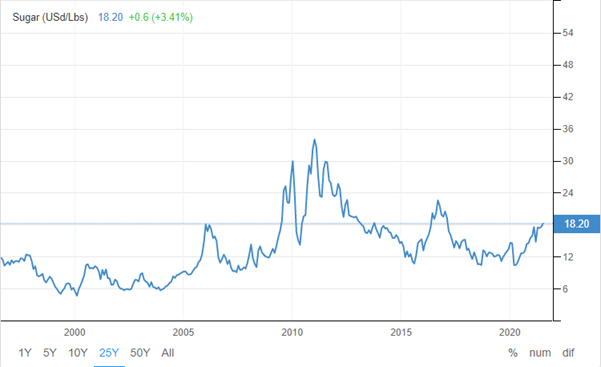
Prices of Global Sugar:
The prices of sugar move in conjunction with sugar inventories as explained earlier. Since sugarcane is a water intensive crop, good and bad monsoons impact the global balance of sugar largely. The moving prices of the commodity lead to disruption also in the financial strength of the sugar companies.
Brazil was the first country to start diverting sugar towards ethanol to reduce the cyclicity in sugar prices in the overall sugar business. India is set to follow Brazil’s footsteps in order to move away from auto fuels, thereby complying to the carbon emission norms, due to higher ethanol blending (20% blending as planned by 2023).
We had stated earlier that Brazil and India's production whereas Thailand's exports are the determinants of the global balance. Let us explain you why?
Around ~45-50% of the world production comes only from Brazil and India. Furthermore, India has the highest cost of production i.e., India is in the upper quartile in the global cost curve (due to high cane prices). Bad crop in Thailand and Brazil has surged the global prices which led to highest ever exports from the Indian millers of around ~7.2 MT, thereby enabling to clear the inventory levels.
The above chart shows depict the cost differentiation of the major sugar producing countries
(Source - ICICI Sec, JM Financials, Edelweiss, Kotak Sec and other brokerage reports)
Brazil’s Trajectory:
Brazil has been the world’s largest sugarcane producer for many decades. Substantial sugarcane production in Brazil is finding its way for ethanol production. Enabling realignment of cane grower and crusher interests, leading to faster growth compared to Indian sugar industry which was crippled by political interference and control. Major of the Brazilian’s sugar mills are flexible and can produce more sugar or ethanol depending on the price premium of one over another. Diversion of sugarcane for ethanol production is higher when oil prices are high and international sugar prices are low.
Brazilian sugarcane diversion towards Ethanol production and Ethanol blending rate
(Source - ICICI Sec, JM Financials, Edelweiss, Kotak Sec and other brokerage reports)
Around 2007-2009, the crude oil prices had spiked which led to a higher blending of ethanol. Likewise, in 2009 the prices of crude oil tanked leading to lower blending but, over the years the blending rate has been increasing in Brazil owing to the carbon control policies. Brazil and USA have been amongst the countries where ethanol drive has been successful. India has now started to act and has adopted a similar route as Brazil. This would help India to reduce its crude oil import bill by around $1 bn. The Indian government has been very active to promote the ethanol blending program (EBP) due to tremendous inventory pressure and inconsistent perennial cashflows Indian millers have experienced in the recent years. This EBP will not only help reduce the import bill but will also help by way of higher sugar diversion towards the ethanol to avoid higher sugar production.
In 2009, Flex Fuel Motorcycle (FFM) was launched in Brazil. A flexible-fuel vehicle or dual-fuel vehicle is an alternative fuel vehicle with an internal combustion engine designed to run on more than one fuel, usually gasoline blended with either ethanol or methanol fuel, and both fuels are stored in the same common tank. As of now, 19 automakers produce ~200 FFV models while 14 models of FFMs are produced. In total 74% of all vehicles in Brazil are run on flex fuels, while 24% run on gasoline and remaining 2% on ethanol. Transportation accounts for ~11% of India’s carbon emission, and 10% ethanol blend with gasoline can potentially moderate the carbon monoxide load of gasoline emissions by ~30%.
The ethanol industry is considerably smaller currently. But as and when this industry grows and how the dynamics of Electronic Vehicle play will be interesting to watch.
India
Indian Sugar Stories:
Indian sugar industry has been hated for its cyclicality and volatile nature. It used to have 2-3 years of production upcycle followed by 4-5 years of downcycle. As reiterated earlier, sugar is largely determined by supply than demand. The above picture explains the twist and turn that the sugar industry historically witnessed. High production of sugar would lead to ample sugar availability which led to fall in sugar prices. A fall in prices lead to a lot of pressure on the millers to sell their sugar in the market which further lead to weakening of the balance sheet, thus making the counter very risky and volatile. Since the millers were unable to generate the revenue, they could not pay the farmers on time leading to a decline in revenue for the farmers, which would discourage them to grow sugarcane and they would shift to other crops like wheat, paddy etc.
To overcome the above problem, the government started taking some serious measures by introducing ethanol. Introduction of ethanol has changed the mechanism of the operation of this sector.
Before we understand the impact of ethanol on the industry, lets understand the structure of the industry.
Indian Acreage:
Acreage refers to the total area under cultivation
The acreage until 2018 use to depend on the profitability of the sugar season. The story post 2018 has changed quite a bit (explained in the later part of the blog). Over the past 20 years the acreage has been range bound. The current acreage stands at 52.68 lakh hectares and is expected to be 54.55 lakh hectares in SS 2021-22, resulting in 4% increase. With the current scenario the incremental acreage does not seem to post a threat as ethanol blending and global deficit of sugar may be able to absorb the excess cane, but what happens when this acreage is increasing constantly, will be interesting to witness.
Below is a breakup of state wise acreage:
- Uttar Pradesh followed by Maharashtra produce more 75% of the sugarcane and sugar.
- Most of the mills are also located in the above two states
Sugarcane Production:
Sugarcane production has not been linear in growth, rather it has been bumpy. As explained earlier the supply side of the industry has been the main reason for this problem. Further, UP farmers have shifted to a new variety of sugarcane (‘early variety’- CO0238) which yields a 40% higher sugarcane output (75-80t/ha vs. 55-60t/ha earlier) and results in a higher recovery rate; this has driven UP’s production to go from 6-8 MT to 10-12 MT. Sugarcane crushing (for sugar) is generally at 75% of the total production.
Now that we have the basic numbers running in our mind lets understand the price structure and overhang in this industry. India does not have any fully integrated sugar companies i.e., farmers grow sugarcane and sell it to the mills at a fixed price (FRP) as decided by the government and mills then process the cane further and convert into the sugar.
(Source - ICICI Sec, JM Financials, Edelweiss, Kotak Sec and other brokerage reports)
Following are the existing overhangs in this industry: -
- Higher FRP prices leading to cost in-competitiveness
- Volatility in domestic sugar prices
- Cheaper Imports (now safeguarded with a 100% import duty)
- Recovery rates
- Cane arrears
- Lower distillery capacities
FRP & SAP – Exorbitant increase in sugarcane prices:
(Source - ICICI Sec, JM Financials, Edelweiss, Kotak Sec and other brokerage reports)
The root cause of the problem is high price for raw material. Prices of cane have been very high and leave very little margin for the mills and at time no margin to earn which leads to losses. Since the prices of sugarcane are so high, farmers are always inclined to grow this crop. India is also amongst the highest cost producers of sugar and the domestic sugar prices are uncompetitive to global prices on account of higher sugarcane prices.
Even though the GOI fixes the FRP of sugarcane for the country as a whole, some State governments announce SAP, generally higher than the FRP that lead to cane price arrears of farmers as sugar mills are unable to pay high SAP especially in years of low sugar prices in the market. There is a lot of political influence while deciding the prices.
So, in a snapshot, sugarcane prices are fixed and can range up to ~ Rs. 30/kg or even higher; while sugar prices are market driven, it has a floor of Rs. 31/kg. The above is the reason why Indian sugar millers have struggling to break through.
Sugarcane arrears:
(Source - ICICI Sec, JM Financials, Edelweiss, Kotak Sec and other brokerage reports)
The government has mandated that the mills should clear the dues of the farmers within 14 days of the receipt of cane. Now the harvest season is from Oct – March, which means the mills have to pay the farmers 9 months in advance and have to sell sugar throughout the year. This leads to high working capital cost. The government fixes FRP for sugarcane but Punjab, Uttarakhand and Uttar Pradesh announce the State Advised Price (SAP), higher than FRP, which results in cane price arrears and adversely affects financial health of sugar mills. Arrears were highest in 2018-19 which then declined in 2019-20.
As we know mills are to pay FRP to farmers within 14 days, failing which mill shall pay interest on the amount due at the rate of 15% p.a.
As of May 2021, sugarcane arrears accruing to farmers rose to Rs 21,321 crore. Of that Rs 18,820 crore is for the cane supplied in the current season, which will end in Sept, while the remaining Rs 2501 crore is from previous years.
According to media article, UP sugar mills have cleared 100% payment to cane farmers for SS 2020 and 61% of the cane price for SS21. Cane arrears are resultant of mismatch between: -
- Cane prices and sugar prices.
- Cash inflow and cash outflow.
- Lack of linkages between cane prices and sugar prices making cane prices unaffordable.
- Exports are not viable without government subsidies, thereby adding to higher inventory blocking cashflows.
Rising cane cost with declining sugar prices leads to increase in farmer arrears
(Source - ICICI Sec, JM Financials, Edelweiss, Kotak Sec and other brokerage reports)
The high inventory results into a major issue in this industry. The mills have to pay their FRP/SAP to the farmers within 14 days whereas the sugar realization may take up to 12-15 months resulting in a huge cash crunch. In order to manage their working capital these millers then move towards higher Debt-Equity. Mounting cane arrears, higher debt levels and negative cashflows becomes an endless loop. FRP has been in place for a very long time. Earlier it was known as Statutory Minimum Price (SMP).
Cost of sugarcane:
The above is the state-wise cost of sugarcane
(Source - ICICI Sec, JM Financials, Edelweiss, Kotak Sec and other brokerage reports)
UP based companies are more efficient, as they get water from perennial rivers originating from Himalayas, whereas the peninsular Indian regions such as Maharashtra and southern India are more dependent on the rains and dams filling up during monsoon
With higher cane arrears, one must be wondering why will farmers increase their sugarcane production?
Why not shift to any other crop, as sugarcane itself is a very water intensive crop?
Why would farmers find it profitable to grow sugarcane even with mounting cane arrears?
Let’s understand this with the following chart: -
|
Profitability of sugarcane crop vs another crops
(2020-21)
|
Yield (Qtl/ha)
|
NSP/MSP (INR/Qtl)
|
Cultivation Cost (INR/Qtl)
|
Net Earnings (INR/ha)
|
|
Maharashtra
|
|
|
|
|
|
Wheat (Rabbi)
|
28
|
1,925
|
1,565
|
10,080
|
|
Soybeans (Kharif)
|
10
|
3,880
|
2,589
|
13,117
|
|
1 wheat + 1 soybean (A)
|
4,154
|
23,197
|
|
Sugarcane (B)
|
847
|
285
|
134
|
1,27,897
|
|
|
|
|
|
|
|
Uttar Pradesh
|
|
|
|
|
|
Wheat (Rabbi)
|
40
|
1,925
|
838
|
43,480
|
|
Paddy/Rice (Kharif)
|
37
|
1,868
|
924
|
35,117
|
|
1 wheat + 1 paddy (A)
|
1762
|
78,597
|
|
Sugarcane (B)
|
750
|
315
|
125
|
1,42,500
|
From the above, it can be understood that sugarcane remains far more remunerative crop for the farmers than any other. Since the sugarcane prices are high, farmers are always more inclined to grow this crop. The wide gap between cost of production of sugarcane and realization of sugarcane has been the main reason for India being uncompetitive in the global market.
Domestic Sugar levels:
For decades, Sugar production & sugar inventory have been most painful for the mills and the government to handle. As seen from the graph, consumption of sugar has been constant while production and inventory have been bumpy. The industry maintains a minimum inventory of 4-5 MT, as against the large inventories that use to be held. Inventory comes with a high cost of holding.
Now, as explained earlier the cyclicity in the sugar prices were hitting the mills hard leading to losses and high debt. To overcome this the government in 2018 came up with the concept of MSP (Minimum Selling Price).
To understand this further, let’s look at the Indian sugar balance:
|
Y/E
September; Mn tonnes
|
SS10
|
SS11
|
SS12
|
SS13
|
SS14
|
SS15
|
SS16
|
SS17
|
SS18
|
SS19
|
SS20
|
SS21E
|
|
Opening stock
|
3.4
|
4.9
|
5.9
|
6.2
|
8.9
|
7.5
|
9.6
|
8.2
|
4.4
|
10.8
|
14.7
|
10.7
|
|
Production
|
18.9
|
24.4
|
26.3
|
25.1
|
24.4
|
28.3
|
25.1
|
20.3
|
32.3
|
33.2
|
27.39
|
30.7
|
|
Uttar Pradesh
|
5.2
|
6
|
7
|
7.5
|
6.5
|
7.1
|
6.8
|
8.8
|
12
|
11.8
|
12.6
|
10.6
|
|
Maharashtra
|
7.1
|
9.1
|
9
|
8
|
7.7
|
10.4
|
8.4
|
4.2
|
10.7
|
10.7
|
6.2
|
10.7
|
|
Karnataka
|
2.6
|
4.1
|
3.8
|
3.3
|
4.2
|
5
|
4
|
2.1
|
3.7
|
4.4
|
3.5
|
4.9
|
|
Tamil Nadu
|
1.3
|
1.9
|
2.3
|
2
|
1.4
|
1.1
|
1.4
|
1.1
|
0.7
|
1
|
0.79
|
0.8
|
|
others
|
2.8
|
3.3
|
4.2
|
4.4
|
4.6
|
4.6
|
4.4
|
4
|
5.2
|
5.2
|
4.3
|
3.7
|
|
Imports (excl raw sugar for refineries)
|
4.1
|
0
|
0
|
0.7
|
1.2
|
1.2
|
0
|
0.4
|
0.2
|
0
|
0
|
0
|
|
Local consumption
|
21.3
|
20.8
|
22.6
|
22.8
|
24.2
|
25.1
|
24.9
|
24.5
|
25.5
|
25.5
|
25.7
|
26
|
|
India population YoY growth
|
1%
|
1%
|
1%
|
1%
|
1%
|
1%
|
1%
|
1%
|
1%
|
1%
|
1%
|
1%
|
|
Exports
|
0.2
|
2.6
|
3.4
|
0.3
|
2.8
|
2.3
|
1.7
|
0
|
0.6
|
3.8
|
5.7
|
7.2
|
|
Closing stock
|
4.9
|
5.9
|
6.2
|
8.9
|
7.5
|
9.6
|
8.2
|
4.4
|
10.8
|
14.7
|
10.7
|
8.2
|
|
|
|
|
|
|
|
|
|
|
|
|
|
|
|
# of months consumption
|
2.7
|
3.4
|
3.3
|
4.7
|
3.7
|
4.6
|
4
|
2.2
|
5.1
|
6.9
|
5
|
3.8
|
If you compare the sugar price chart given earlier as against the inventory holding levels, you will see how the prices move when the inventory rise and fall. India has decisively moved into a structural surplus scenario wherein gross sugar production would be above 30 MT (vs. 18-28 MT earlier) thanks to
- Exceptionally high profitability of crop and
- Government policies (to ensure farmers get paid)
In such a scenario excess sugar can only be addressed through
- Exports (subsidies possible only until 2023),
- Diversion towards ethanol and
- High sugar prices (current scenario)
Indian Trade Data:
As of 30th June 2021, 7.2MT has been contracted
As of 30th June 2021, 7.2 MT has been contracted. In India the sugar season is from Oct-Sept. We directly come onto the last 3 years of SS. India had an excess inventory in SS 2019 of ~15 MT. In order to deal with this excess inventory, GOI imposed import duty on sugar. Moreover, with the help of government aid in form of subsidies, India has been able to export higher volumes of sugar in last 3SS. Exports are however not the best option to get rid of these excess inventories all the time. India has a very high cost of production of sugar. In order for the millers to make profits the global sugar prices needs to be highly lucrative.
All India average cost of production of sugar is in the range of Rs. 29-31/Kg. For the Indian sugar producers to make profit on exports the global prices would have to be around ~¢19 (not considering the government subsidies) in order to break-even.
This price of ¢19 (Rs 31.35) will not encourage the millers in UP for higher exports as UP is situated in the central part of the country, these mills would have to incur Rs. 1/Kg for domestic freight charges. Furthermore, the sugar companies in UP sell their sugar at a price around Rs. 34-36/kg. Also, the companies situated in southern region may also find it difficult to exports at these rates as the recovery rates in south were merely ~9% which has now started going up to ~10%. Maharashtra and the southern millers may however evaluate this option to export at ¢19 as they’re situated near ports, therefore not incurring domestic freight.
Irrespective of the above, the current global scenario seems to be in favor of the Indian exporters, as the global demand-supply mismatch is pushing up the global prices. Imports in India have usually only been in the years of shortages due to drought, inadequate monsoons etc.
Government Initiatives:
Government has aimed to structurally change the dynamics of the sector by way of various government initiatives:
- Introduction of MSP
- Quota System (for sales)
- Export initiatives
- Buffer stocks
- Subvention loans
- Ethanol Blending Program (EBP)
These initiatives will moderate the cyclicality in this sector and will make it more predictable going forward. These initiatives seem to have been working as the in last few quarters the sugar sector has been on a rise and the companies have been reporting higher profitability.
Introduction of Minimum Selling Price (MSP):
MSP was introduced in 2018 to cap the decline and to provide some stability in the domestic prices of sugar. MSP was introduced not just with the view of protecting sugar companies from reducing sugar prices but also to safeguard the farmers from mounting cane arrears. Initially the government had fixed the MSP at Rs. 29/Kg which was further increased to Rs. 31/kg. The industry has now appealed to the GOI for a further hike in MSP to Rs. 34/Kg. The benefit of MSP is that whenever India had a record sugar production, sugar prices fell significantly in the next year. However, this time, sugar has a floor price of Rs. 31/Kg despite of inventory being at record high at ~15 MT MSP has therefore helped reduce cyclical risk of the sector dramatically and made the profitability more predictable.
Quota System:
Along with announcing the support price for selling sugar, the government also re-introduced mill-wise quota for selling sugar. This regulated the quantity of sugar being sold in the market which in turn helped to keep the domestic sugar prices afloat Rs. 31/kg. The quota mechanism was earlier used in 2013. Sales quota mechanism was implemented by the GOI in order to have a control over the supply of sugar in the market.
There is no cap on production but the sales have been regulated by the government
(Source - ICICI Sec, JM Financials, Edelweiss, Kotak Sec and other brokerage reports)
Sugar sales more or less matches sales quota, there is no material breach.
Export Initiatives:
During the year of surplus production, the industry has to manage inventory levels beyond domestic demand. As mentioned earlier the global prices aren’t very lucrative to the Indian sugar producers, therefore the GOI decided to incentivize the exports during periods of high inventory. The government announced MIEQ scheme to encourage exports of sugar to reduce the surplus in the country. Under the MIEQ, the industry will be allowed to export 6 MT (SS 2020-21) of duty-free exports. Furthermore, to incentivize the Indian millers due to higher cost of production, GOI announced an export subsidy. The sugar millers were getting an export linked production subsidy of Rs. 8/kg and Rs. 3/kg for transportation, therefore leveling the exports by Rs. 11/kg. With the recent up-move in the global prices along with the government subsidies, exports became a viable option for the Indian millers. As the global prices surged the GOI reduced this subsidy which currently stands at Rs. 4/Kg. This initiative help reduce the inventory levels in India and exports expanded to 7.2 MT up to June2021, which was much above the expected 6 MT i.e. (6 MT through subsidies and 1.2 MT through OGL).
Buffer Stock:
The government has created a buffer stock of 4 MT tonnes of sugar to maintain demand-supply balance in the domestic market and to stabilize sugar prices, thereby improving liquidity of sugar mills enabling them to clear cane price arrears of farmers. The holding cost for this 4 MT would be reimbursed by the GOI.
Subvention Loans:
To encourage investment in distillery capacities, government is giving subvention loans. The government will bear the interest cost for first five years, including a year of moratorium against the loan availed. Interest subvention will be available to only those distilleries that supply at least 75% of the ethanol from such incremental capacity to Oil Marketing Companies (OMC’s) for blending with petrol. Government is eyeing an investment of over Rs 40000 crore in the distillery expansion. Thus, taking the total Indian capacity to over 1600 Crores liters of ethanol of which 1000 crore will be used for blending with petrol. In order to achieve the blended rate of 20% the government has taken the following decisions in regards with providing subvention loans.
- To bring a modified scheme for extending interest subvention to augment ethanol production capacity.
- The government would bear interest subvention for 5 years including a 1-year moratorium against the loan availed by project proponents from banks @ 6% per annum or 50% of the rate of interest charged by banks, whichever is lower.
Ethanol Blending Program (EBP):
Ethanol is biofuel. The chemical composition of ethanol is C2H6O. It is a very key product for this industry. Ethanol or Ethyl Alcohol is mixed/blended with auto fuel and used in vehicles. The GOI is very keen on increasing the overall blending % as this will reduce the interdependency of the country on crude oil imports (Currently blending is at 8%).
There are two kinds of ethanol generation
- First generation (1G)
- Second generation (2G)
|
Classification
|
Organic Molecule to be converted to Ethanol
|
Raw Material
|
|
1st Generation
|
Sugar
|
Direct juice, B Heavy, C Heavy
|
|
Starch
|
Grains (corn, sorghum, rice, wheat, millet etc.)
|
|
2nd Generation
|
Cellulose and hemicellulose
|
Lignocellulosic biomass (bagasse, sugarcane trash,
corn cobs, rice straw etc.)
|
Companies in India have undertaken many R&D to produce ethanol from “algae” which will be termed as 3G. Setting up a grain-based distillery capacity is however expensive than the cane-based distillery. Ethanol is explained in detail in the latter part of this blog.
Ethanol & National Bio-fuel Program (NBP):
The future viability of the Indian sugar industry will depend on value-addition and diversification through ethanol. EBP was initiated in 2003 on a pilot basis and subsequently extended to 21 States and 4 Union Territories. This program was launched with the intent to reduce import dependence on energy and give a boost to the agriculture sector. The government is targeting a 20% ethanol blending by 2025, which was then preponed to 2023.
GOI has also notified the Ethanol prices of each route, as shown below.
|
INR/litre, Y/E
November
|
ESY18
|
ESY19
|
ESY20
|
ESY21
|
|
Fixed
|
|
June'18
|
Sep'19
|
Oct'20
|
|
C Heavy Route
|
40.9
|
43.7
|
43.75
|
45.69
|
|
B Heavy Route
|
NA
|
52.43
|
54.27
|
57.61
|
|
Sugarcane Juice
Route
|
NA
|
NA
|
59.48
|
62.65
|
|
Damaged food
grains/ Maize
|
NA
|
NA
|
|
51.55
|
|
Ethanol from surplus rice with FCI
|
|
|
|
56.87
|
The ethanol prices are fixed on first December every year. Unlike Sugar season, ethanol cycle runs from every Dec-Nov.
With all of the above explanation, one should understand why Ethanol can really prove to be a turnaround story?
Let’s first understand how ethanol can be a game changing story?
As on July 2018, government allowed sugar mills to manufacture ethanol directly from sugarcane juice or intermediate product called B-molasses, which wasn’t allowed earlier.
The government increased ethanol prices in October 2020 mainly to encourage higher ethanol production. We believe that the B heavy and direct cane juice route are a very good initiative to reduce the oversupply of sugar. Furthermore, the government is in order to make these options more lucrative have kept the prices of ethanol from B heavy route and direct cane juice high, to compensate for the loss in sugar revenue. The most important aspect of all is the efficient working capital management and higher overall margins. The harvesting season in India is from Oct-March and the payment to farmers is to be made within 14 days of cane procurement. Hence the entire payment has to be made within the same period but the production gets sold over the entire year. For sugar, the sales are as per quota every month which is spread over the entire year and hence the inventory holding cost is high. With ethanol, the story is however very different. Ethanol sales are made every month and the realizations are also high, the payment is received within 18 days. This improves the financial health of the company and leads to efficient cashflow management.
Let’s move on to the profitability part of the ethanol story.
|
Particulars
|
Units
|
Conventional
|
B-Heavy
|
Cane Juice
|
|
Cane crushed
|
Tonne
|
100
|
100
|
100
|
|
|
|
|
|
|
|
Recovery Assumptions
|
|
|
|
|
|
Sugar
|
%
|
1%
|
10.50%
|
70 ltr per tonne of cane
|
|
Molasses
|
%
|
4.90%
|
7.00%
|
|
Ethanol
|
% of molasses
|
21.50%
|
30.00%
|
|
|
|
|
|
|
|
Volumes
|
|
|
|
|
|
Sugar
|
tonne
|
11.5
|
10.5
|
0
|
|
Molasses
|
Ltr
|
4900
|
7000
|
|
|
Ethanol (from
molasses)
|
Ltr
|
1053.5
|
2100
|
7000
|
|
|
|
|
|
|
|
Realisations
|
|
|
|
|
|
Sugar
|
INR/tonne
|
31,000
|
31,000
|
31,000
|
|
Ethanol
|
INR/ltr
|
45.69
|
57.61
|
62.65
|
|
|
|
|
|
|
|
Total Revenue
|
|
4,04,634
|
4,46,481
|
4,38,550
|
|
RM Cost
|
INR
|
3,20,000
|
3,20,000
|
3,20,000
|
|
Conversion Cost
|
INR
|
73,551
|
77,878
|
58,415
|
|
Profit
|
|
11,083
|
48,603
|
60,135
|
The profitability under each scenario is different based on the recovery rate of sugar and ethanol in each case as the recovery rates gets better the profitability will improve.
Ethanol and Sugar production process:
Cane based ethanol can be produced in 3 difference ways
- Conventional Route C-Heavy Molasses
- B-heavy molasses
- Direct sugarcane juice route
The volumes of sugar and ethanol produced would differ in each route and the profitability would also depend on this.
Conventional Route/C-heavy:
Conventionally, sugar is extracted in three stages with very little sugar left to be extracted after the third stage. Left over after the third stage is the molasses, which has very less sugar content. This molasses is processed in a distillery for ethanol generation. One tonne of sugarcane crushing normally yields 11 – 11.5 litres of ethanol in the conventional route.
B-heavy route:
Under this route, the sugar extraction process is stopped after the second stage and the molasses post second stage, which is still rich in sugar content, are used for extraction of ethanol. Under this route, one tonne of sugarcane crushing normally yields 22-25 litres of ethanol but total sugar production gets compromised to get higher ethanol.
Direct Juice route:
Under this process, extraction of sugar does not happen and the entire sugar content is used to produce molasses, which are in turn used to generate ethanol. Under this route, one tonne of sugar cane will result into 75-85 litres of ethanol.
As can be seen from the above chart, the direct juice route will be the most profitable segment for the sugar millers. As India is currently in the oversupply zone with high inventory, maximum diversion of sugar is expected in SS21-22. In our opinion B-heavy & Juice route will be most lucrative.
Ethanol Biofuel Program:
Now that we understand ethanol, let’s move on and understand EBP.
This is initiative of the government which came as a silver lining to sugar industry. The entire cause of the falling fate of the sugar industry was excess production. To discontinue the excess production scenario, government started the EBP program in 2003. EBP was initiated in 2003 on a pilot basis and subsequently extended to 21 States and 4 Union Territories. This program was launched with the intent to reduce import dependency on energy and give a boost to the agriculture sector. Post the launch of the program, the government has administered prices since 2014 which has significantly improved the ethanol procured by the OMCs from 38o Mn ltrs in 2013-14 to an estimated 1700 Mn ltrs in 2019-20. At 170o Mn ltrs of ethanol, the blending is ~5% and for 2019-20, the government is targeting 8.5% blending, which would require 325o Mn ltrs (as of 12th Jul 2021, the blending ratio stands at ~8%.
Ethanol pricing doesn’t follow any demand supply mechanism. The pricing of ethanol is fixed and is shared by the government in every October for the ESY (Dec – Nov). The price of ethanol is derived from the sugarcane pricing and the same is not crude linked.
The new EBP program stipulates procurement of ethanol produced directly from B-grade molasses, sugarcane juice, and damaged food grains such as wheat and broken rice. India’s ethanol blending program was always based more on sugar molasses, and not directly from sugarcane, corn, or any other potential raw material sources. The new biofuels policy has increased the scope of including other raw materials.
Separate pricing has been decided for three different routes namely conventional, B-grade and directly from sugarcane. The government has allowed production of ethanol from damaged food grains and OMCs are offering differential pricing. GST rate on ethanol was also reduced to 5% from 18% earlier to boost the ethanol production. Control of production, movement and storage of ethanol has been passed on to the central government under the new scheme in order to ensure smooth implementation of EBP program and to facilitate centralized monitoring.
Under this EBP the prices of ethanol got delinked with global crude prices and were linked with the sugarcane FRP prices. Ministry of Petroleum and Natural gas is authorized in India under the EBP to increase ethanol prices once FRP is increased by the central government. This is by far one of the most important aspect of the NBP.
Earlier ethanol prices were linked to the crude oil prices. The millers therefore had a higher exposure as the cane procurement was based on FRP and ethanol realization were linked to crude which is highly volatile bringing instability in ethanol pricing. Thus, under the current regime, the ethanol prices are indifferent to any movement in the crude oil prices. However, there is an ongoing debate that any correction in the crude prices (which currently stands at $70) will increase the cost of ethanol for the OMC’s due to higher blending. But in our view as there is no direct relationship between the crude and ethanol prices anymore, this could not be a considerable threat to the sugar industry. The ethanol prices are expected to move in line with the FRP prices.
Existing ethanol distillery capacities:
|
No of distilleries (ESY20)
|
Distillery capacity (Million litres)
|
|
|
Pvt
|
Co-op
|
Standalone
|
Total
|
Pvt
|
Co-op
|
Standalone
|
Total
|
|
Maharashtra
|
34
|
36
|
26
|
96
|
580
|
360
|
330
|
1,280
|
|
UP
|
36
|
8
|
11
|
55
|
1,200
|
60
|
230
|
1,500
|
|
Karnataka
|
23
|
3
|
3
|
29
|
718
|
25
|
41
|
784
|
|
Tamil Nadu
|
9
|
2
|
1
|
12
|
164
|
17
|
22
|
203
|
|
AP
|
8
|
-
|
-
|
8
|
81
|
-
|
-
|
81
|
|
Telangana
|
3
|
|
-
|
3
|
46
|
-
|
-
|
46
|
|
Gujarat
|
-
|
9
|
3
|
12
|
-
|
70
|
41
|
112
|
|
Others
|
13
|
1
|
2
|
16
|
222
|
18
|
46
|
264
|
|
India
|
126
|
59
|
46
|
231
|
3,010
|
550
|
710
|
4,270
|
|
Ethanol Supply
|
|
Million
litres
|
ESY 21
|
|
Total demand
|
4,570
|
|
offered
|
3,250
|
|
contracted
|
2,980
|
|
Cane base (Juice/B/C)
|
2,620
|
|
Grain
|
360
|
|
Supplied
|
1,000
|
|
B route and
juice
|
770
|
|
C route and
others
|
230
|
The demand is ~3250 Mn ltrs from fuel ethanol and ~1500 Mn ltrs comes from (ENA, industrial use etc.). Currently there are ethanol imports of ~700Mn liters (mainly used to produce ENA). As stated earlier we see ~6000-7000 Mn ltrs ethanol demand can be met from cane and balance from grains at 20% blending. Of this 6000-7000 Mn ltrs ethanol we see ~70% coming from B heavy and balance 30% shall come from A & C heavy equally. 5-10% of distillery volumes would comprise ENA for mandatory procurement by the UP based country liquor companies.
Ethanol distillery expansion:
The sugar industry has gone under a huge capital expansion phase in last 1 year. India was very low on the distillery capacity. Prior to the NBP, the Indian miller were very hesitant for any distillery expansion due to volatility in the ethanol prices. Due to such high volatility in the, the millers were unsure of the payback period. After ethanol prices got regulated by the government the margins expanded and thus, we’re seeing a huge capital expansion in the ethanol space.
Following are the ethanol capacity expansion by various miller in India.
|
Company wise Installed Capacity
(Sugar/Distillery/Power) and Distillery expansion plan
|
Sugar capacity
|
Distillery capacity (KLPD)
|
Power Capacity (MW)
|
Distillery Expansion (KLPD)
|
Expected Distillery Commissioning Period
|
Post Expansion Distillery Capacity
|
|
Sugar (TCD)
|
Refinery (TPD)
|
|
Shree Renuka
|
37,500
|
5,500
|
720
|
567
|
|
|
720
|
|
Bajaj Hindustan
|
1,36,000
|
-
|
800
|
449
|
|
|
800
|
|
Balrampur Chini
|
76,500
|
-
|
520
|
278
|
320+210
|
Nov-22+
|
1050
|
|
Dhampur Sugar
|
45,500
|
1,700
|
400
|
221
|
100
|
Nov-21
|
500
|
|
E.I.D. Parry (India) #
|
43,800
|
3,000
|
234
|
160
|
150
|
|
384
|
|
Avadh Sugar
|
31,800
|
-
|
220
|
74
|
|
|
220
|
|
Dalmia Bharat Sugar
|
35,500
|
-
|
255
|
120
|
|
|
255
|
|
Dharani Sugars
& Chem.
|
10,000
|
-
|
160
|
37
|
|
|
160
|
|
Triveni Engineering
& Ind.
|
61,000
|
-
|
320
|
105
|
|
|
320
|
|
Bannari Amman
|
23,700
|
-
|
128
|
130
|
90
|
FY21
|
218
|
|
Sakthi Sugars
|
19,000
|
-
|
150
|
92
|
|
|
150
|
|
KM Sugar Mills
|
9,000
|
-
|
50
|
25
|
|
|
50
|
|
Uttam Sugar Mills
|
23,750
|
-
|
150
|
103
|
50
|
Q3FY21
|
200
|
|
Gayatri Sugars
|
6,000
|
-
|
45
|
25
|
|
|
45
|
|
Kothari Sugars
& Chem
|
6,400
|
-
|
60
|
33
|
|
|
60
|
|
Magadh Sugar ^
|
19,000
|
-
|
80
|
38
|
75
|
|
155
|
|
Rana Sugars
|
16,500
|
-
|
60
|
123
|
180
|
|
240
|
|
Sir Shadi Lal
Enterprises
|
7,500
|
-
|
70
|
-
|
30
|
|
100
|
|
Dwarikesh Sugar
|
21,500
|
-
|
130
|
91
|
|
|
130
|
|
Thiru Arooran
Sugars
|
8,500
|
-
|
60
|
47
|
|
|
60
|
|
Mawana Sugars
|
19,000
|
-
|
120
|
47
|
30
|
|
150
|
|
DCM Shriram
|
38,000
|
700
|
350
|
141
|
|
|
350
|
Ethanol Requirement:
Indian sugar demand stands at a stagnant number of ~26 MT, whereas Indian sugar millers can produce around ~32 MT of sugar, therefore the ethanol requirement from sugarcane is as much as diversion of ~6MT of sugar. Beyond this ethanol requirement can only be met from grains and other sources. So ~6000-7000 Mn ltrs of ethanol at max can be generated from sugarcane.
|
Diversion of sugar for ethanol
|
|
Mn tonnes
|
SS20
|
SS21E
|
|
UP
|
0.37
|
0.67
|
|
Maharashtra
|
0.14
|
0.66
|
|
Karnataka
|
0.24
|
0.54
|
|
Others
|
0.1
|
0.1
|
|
Total
|
0.85
|
1.97
|
The 20% blending program has been preponed to 2023
As on today ~3250 Mn ltrs demand comes from fuel ethanol and ~1500 Mn ltrs comes (ENA, industrial use, etc). EBP @20% we believe will require ~12000 Mn ltrs of total ethanol of which ~6000-7000 Mn ltrs of ethanol requirement can be met from sugarcane and balance will come in from grains and imports.
The positives of the entire NBP can also be seen from the distillery expansion undertaken by OMC’s as well.
(Source - ICICI Sec, JM Financials, Edelweiss, Kotak Sec and other brokerage reports)
Apart from sugar milers, OMCs are also aggressively spending on expanding 2G ethanol capacity. 100 KLPD bio-refinery would cost INR. 800cr investment. Currently, OMCs are in process of setting up 12 2G bio-refineries with a total investment of INR 10,000 cr. This should lead to capacity addition of 1200 KLPD.
Co-generation:
In the sugar process bagasse is one of the by-products. Bagasse is used as a raw material in the paper industry as well to make paper and also to produce power. Most of the integrated sugar mills use this power for their captive use and sell excess power. Sugar sector is one of those industry which creates its own power and the excess power is sold to either the state discom’s or to any other private entity.
Cogen accounts for around 3-10% of the total revenue mix of these sugar companies. Recently however in UP the contribution of the cogen reduced as the UPERC revised the rates at which this excess power was sold. Rates were reduced from Rs5/unit to Rs3/unit of power sold. The millers had also appealed with CERC to reverse this decision, the case however is still ongoing. Due to this most of the millers would be contemplating selling bagasse to paper companies as current price of bagasse is ranging from 1.5-2.5 / kg, which is fetching better realization compared to power.
Due to lower realization the sugar companies had stop expanding their cogen capacity. Few of these sugar companies have now shifted to short term market (power exchanges) to sell their excess power production instead of selling it under the PPA. As the acreage is expected to rise in India, higher cane crushing would lead to higher power generation through bagasse, thus, this would increase the revenue of these millers from selling the incremental power, either on the exchange or by selling the same on the exchanges.
Key concerns:
We believe the sugar sector has some favorable tailwinds considering the actions taken by the Government to protect the sector. These changes seem to be structural in nature, but we think that none of these tailwinds are derived market based but based on the Government policy changes. Further there seems to be low competitiveness in the entire value chain mainly because of higher CoP (large part of the value) of sugar which makes things worse, but just can not be addressed given the political agenda. Though EBP program mainly has given reasons to look at the sector again, we remain cautious by not being a BUYER AT ALL LEVELS.
Some of the key concerns to the entire industry could be as follows:
- Unfavorable ethanol pricing
- Regulatory risks
- Volatility in sugar prices
- Increase in acreage
- Increase in SAP / FRP prices
- Higher production and high inventory levels
- Working capital management
- Weather conditions
- Farmers diverting to alternate crops
- Sugarcane arrears
- Short life of ethanol with quick pick up in EV
Due to various government initiatives and favorable policies, the entire sugar sector has been re-rated. Where some stocks are now being traded at 8-10 P/E. However, beyond that, the mathematics required in this sector would just be same as in any other businesses of what is the incremental profit that a company would generate or what is the incremental capacity expansion that a company can undertake, thus resulting in to a higher cashflows. But also, do remember to think this sector as a CYCLICAL at least when you are buying it; do not over pay for the enthusiasm.
Thank You
Authored By Ashutosh Chaubey
Moderated By Manali Gala
Source of the data:
Some of the data used in this blog is created by Centra, while some data may have been fetched through various websites, content, files, brokerage house notes, etc. available freely on the social media.
Disclosure:
The information herein is used as per the available sources of exchanges, company’s annual reports & other public database sources. Centra Advisors is not responsible for any discrepancy in the above-mentioned data. Investors and readers of this blog should seek advice of their independent financial advisor prior to taking any investment decision based on this blog or for any necessary explanation of its contents. The blog is based on personal opinions & views of the author. Readers are responsible for all outcomes arising of buying / selling of particular scrip / scrips mentioned here in. This report indicates opinion of the author & is NOT A RECOMMENDATION to buy or sell securities. Centra Advisors & its representatives may or may not have any vested interest in above mentioned securities at the time of this publication. Centra Advisors, or it’s associates are not paid or compensated at any point of time, or in last 12 months by any way from the companies mentioned in the report. The views expressed in this post accurately reflect the authors personal views about any and all of the subject securities or issuers; and no part of the compensations, if any was, is or will be, directly or indirectly, related to the specific recommendation or views expressed in the report.